
Understanding the Quincy Framework: A Deeper Look at GDP Reports

Updated: Jun 8
A positive economic report can be accurate and still leave important questions unanswered.
That is the essence of this Quincy Framework test.
In the first quarter of 2026, the Bureau of Economic Analysis reported that real GDP increased at an annual rate of 2.0 percent. This was an improvement from the previous quarter, when real GDP increased by only 0.5 percent. On the surface, the standard interpretation of this GDP report seems straightforward: the economy grew faster than it did in the previous quarter. This interpretation is not wrong.
However, the Quincy Framework asks a different question.
Not simply, “Did GDP increase?”
But rather:
What kind of increase was it?
Was the growth broad?
Was it durable?
Was it supported by real demand?
Was it dependent on temporary effects?
Was inflation masking part of the improvement?
Were there weaknesses beneath the top-line GDP result number?
This is where Quincy begins to add value as a structural risk and decision risk lens.
A Hidden Risk Analysis of the Top-Line GDP Result
The standard reading of the GDP report is positive.
Real GDP accelerated from 0.5 percent to 2.0 percent. Consumer spending, investment, government spending, and exports all contributed positively. However, imports also increased, which subtracts from GDP under the standard calculation.
This gives users a valid first-level conclusion:
The economy improved compared to the prior quarter.
For many readers, that may be sufficient. If the only question is whether GDP went up or down, the answer is clear.
But for decision-makers, investors, analysts, executives, and risk managers, the top-line GDP result may not be enough. A positive number can still contain weaknesses that matter.
This is the space Quincy is designed to inspect.
The Value of Quincy: A Structural Risk Lens
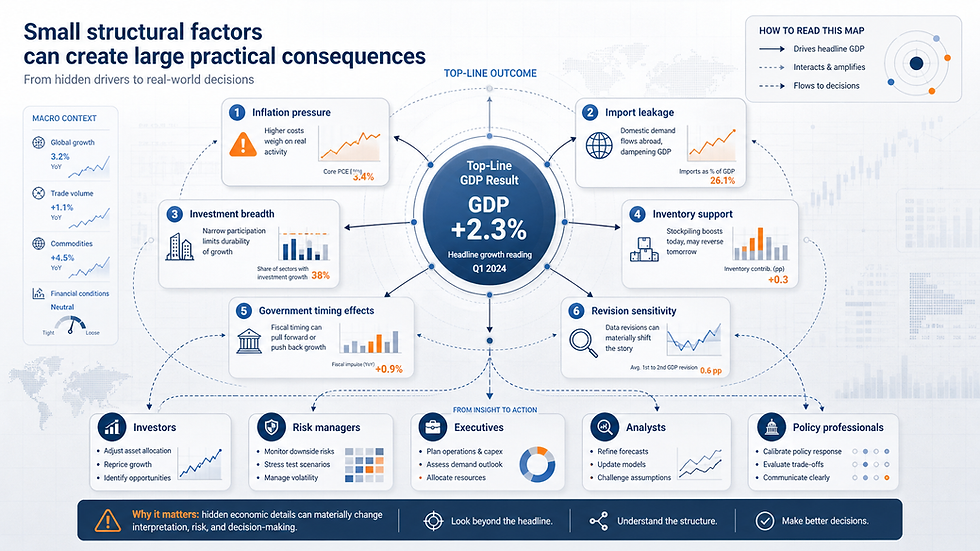
This Hidden Risk Analysis shows how the Quincy Framework can preserve the official GDP result while exposing the structural conditions beneath it. These include inflation pressure, import leakage, uneven investment breadth, temporary rebound risk, accounting boundaries, and revision uncertainty.
What Quincy Does Differently
Quincy does not change the empirical facts. It does not invent a new GDP number. It does not claim the governing body is wrong. It does not make a forecast. It does not tell the user what decision to make.
Instead, Quincy strips the GDP report into its structural components and asks how strong the underlying condition really is.
In this test, Quincy accepted the positive GDP growth result but classified the quarter as:
Mixed-positive expansion with uneven structural quality and moderate durability uncertainty.
This means the quarter was not weak. It was not negative. It was not dismissed.
But it also was not classified as clean, broad-based structural acceleration.
That distinction is the entire point.
The Quincy Framework does not aim to replace economic analysis. It seeks to deepen it by exposing the decision risk that may be hidden beneath a standard top-line GDP result.
Quincy Output Summary
Below is a condensed version of the Quincy-style interpretation from the test report.
Top-Line GDP Result
Real GDP increased at a 2.0 percent annual rate in the first quarter of 2026, following a 0.5 percent increase in the fourth quarter of 2025. Consumer spending, investment, government spending, and exports contributed positively. Imports increased and subtracted from GDP.
Quincy Structural Result
The quarter resolves as a positive but mixed expansion state. Aggregate output improved, but the improvement depends on services-led consumption, selected equipment and software strength, inventory support, government contribution, and trade-category effects that do not uniformly convert into durable productive expansion.
Quincy Classification
Mixed-positive growth signal
Yellow classification
58 out of 100 structural score
Positive growth with incomplete durability confirmation
Primary Divergence
The top-line GDP result view emphasizes acceleration. The Quincy view emphasizes the uneven structural quality of that acceleration.
This is the heart of the structural risk difference.
The official GDP report tells us the economy accelerated. Quincy asks whether that acceleration is broad, durable, and decision-relevant.

Where the Divergence Appears
The divergence is not between true and false. It is between top-line GDP result direction and structural condition.
The top-line GDP report tells us the economy moved faster.
Quincy asks whether the engine underneath that movement is stable enough to trust.
This type of economic risk analysis can matter significantly. The same official data can support a positive top-line GDP result while also revealing hidden fragility beneath the surface.
1. Inflation Pressure
Nominal GDP increased much faster than real GDP. This matters because it means part of the apparent expansion was price-supported rather than purely volume-driven.
From a standard view, growth improved.
From a Quincy view, the quality of that growth is constrained because inflation reduces how much of the nominal increase converts into real purchasing-power expansion.
This creates a real-versus-nominal divergence.
For investors and decision-makers, that distinction matters. GDP growth supported heavily by price increases may not carry the same strength as growth supported by broad real activity.
That is a structural risk signal, not a rejection of the official result.
2. Import Leakage
Domestic demand remained positive, but imports also increased.
This matters because some domestic demand was being satisfied externally. In standard GDP accounting, imports subtract from GDP. In structural terms, Quincy treats that as a leakage point.
The economy may show demand strength, but if part of that demand is being met outside the domestic production base, the structural meaning of that demand becomes more limited.
This is where the Quincy Framework creates decision intelligence.
The top-line GDP result says demand exists.
The deeper analysis asks where that demand is being absorbed.
For economic analysis, supply chain planning, investment risk review, and business strategy, that difference can be important.
3. Uneven Investment Breadth
The standard report says investment contributed positively.
Quincy asks what kind of investment contributed.
In this test, the investment picture was uneven. Equipment, software, and inventories supported growth, while residential structures and nonresidential structures weakened the broader investment signal.
This creates an important distinction.
A positive investment category does not always mean broad capital deepening. It may mean strength in selected areas while other fixed-investment categories remain weak. For capital allocators, this matters because investment risk is rarely evenly distributed. A top-line investment gain can hide sector weakness underneath.
That does not make the positive GDP report wrong.
It makes the risk assessment more complete.
4. Temporary Support Risk
Some components may support one quarter without proving durable strength.
Inventory accumulation, government spending timing, and trade-category volatility can all improve a quarterly number without confirming that the economy has entered a stronger long-term expansion state.
Quincy does not assume these supports are bad.
It simply refuses to treat them as permanently resolved without confirmation.
That is important because decision risk often lives inside timing effects. A one-quarter rebound can look like strength before later data shows it was temporary.
The Quincy Framework keeps that distinction visible.
5. Accounting Boundary Effects
The BEA release contained accounting and boundary treatments, including tariff refunds excluded from current-quarter GDP treatment and silver bars excluded from the stated trade surge effect.
These are important because they show how official GDP mechanics can differ from the broader economic effects felt across sectors.
Quincy treats those as boundary conditions.
The reported GDP figure remains valid, but the decision-maker should understand that not every meaningful economic effect is fully expressed inside the top-line GDP result number.
This is one of the places where Hidden Risk Analysis becomes especially useful. It separates what is officially counted from what may still matter structurally.
6. Advance Estimate Uncertainty
The report was an advance estimate. This means some source data was incomplete, projected, or assumption-sensitive.
Quincy therefore adds a source-quality layer.
The question is not only what the number says now. The question is how stable the interpretation may be after later revisions.
That matters because early GDP reports can influence market behavior, business planning, investment strategy, and executive risk assessment before all source data is complete. A decision-maker reading only the top-line GDP result may treat the number as settled.
Quincy keeps the provisional nature of the report visible.
Why This Matters for Users
The value of Quincy is not that it tells users what to do.
The value is that it exposes to users what to look at.
For an investor, one small overlooked factor can matter. A slight change in inflation interpretation, inventory durability, import dependence, or sector composition may not change the top-line GDP result number, but it can change the risk profile of a decision.
For a business executive, the difference between broad growth and narrow growth matters. For a risk manager, the difference between durable expansion and temporary rebound matters.
For a capital allocator, the difference between equipment strength and real estate weakness matters.
For a policy analyst, the difference between official accounting treatment and real-world economic pressure matters.
Quincy’s role is to expose those differences before they become obvious in the top-line GDP result. This allows users to make pre-emptive decisions before the factor has caused an effect.
This test shows how the Quincy Framework can add a second layer of economic analysis to a standard GDP report without changing the underlying facts.
Why Small Factors Matter in Economics and Investing
In economics and investing, small factors can create large consequences.
A minor structural weakness may not look dramatic in a public report. But when applied to large investment positions, institutional portfolios, business forecasts, lending decisions, or market exposure, small differences in interpretation can become meaningful.
A single overlooked factor may affect capital allocation.
A small inflation signal may change a risk model.
A weak investment subcategory may affect sector exposure.
Import leakage may change how domestic demand is interpreted.
Inventory support may change whether growth appears durable or temporary.
This is where Quincy may offer real value to users. It does not claim to create certainty. It helps reduce blind spots.
That is the purpose of a structural risk lens added to your analytical data results. The Quincy Lens works in cooperation with your data analysis, not in place of it.
What Peer Review Has Confirmed
A separate review of the Quincy output identified the same core value: Quincy acts as a structural risk overlay. It adds qualitative depth, identifies hidden fragilities, creates a more bounded risk view, and highlights forward-looking triggers such as revisions, inflation path, and investment breadth.
That review also noted a limitation. If someone only needs the simple directional answer, then Quincy may add more complexity than necessary.
That is fair.
Quincy is not built for users who only need to know whether GDP went up or down. It is built for users whose decisions depend on the quality of the underlying conditions.
That distinction is critical.
The Quincy Framework does not compete with the governing-body report. It reads the same report through a different decision-risk layer.
The Main Lesson From This Test
This test does not prove that Quincy can predict the economy. It does not prove that Quincy can outperform traditional economic models. It does not claim that the BEA report was wrong.
What it does show is more practical:
A standard report can be accurate and still leave decision-relevant risk hidden beneath the top-line GDP result.
That is where Quincy adds value.
In this GDP test, the standard interpretation was:
Growth accelerated.
The Quincy interpretation was:
Growth accelerated, but the structural quality of that acceleration remains conditional.
That is not a contradiction. It is deeper classification clarity.
Final Takeaway
The first-quarter 2026 GDP report gave a positive top-line GDP result. Quincy preserved that result.
But Quincy also exposed the conditions underneath it: inflation pressure, import leakage, uneven investment composition, temporary rebound risk, accounting boundaries, and revision uncertainty.
That changes the decision surface.
Not by telling the user what to do. But by showing the user what the top-line GDP result alone may not reveal.
For economic analysis, investing, strategic planning, and risk management, that is where the value sits.
Quincy is not designed to replace the governing-body result. It is designed to inspect, interrogate, and reveal the space between the governing-body conclusion and the decision-maker’s risk exposure.
That is the value of Hidden Risk Analysis.
That is Clarity without Competition.


Comments